Authors:
An original publication of Duke University's DAREC (Digital Asset Research & Engineering Collaborative)
This article compares the present cryptocurrency phenomenon to the dotcom bubble of the late 1990s, and suggests that apparent parallels between the two may be exaggerated.
Download this article as a PDF »
Introduction
The cryptocurrency ecosystem has experienced astounding growth in the last two years, with 400% price increases within a year, as well as the launch of thousands of new coins and tokens. These factors have led the public to compare the crypto phenomenon to the dotcom boom of the late 1990s, in which we saw some 2000 internet IPOs, and their representative index (the Nasdaq) also saw extraordinary gains over a short period.
The Nasdaq’s meteoric rise was followed by a dramatic crash in the early 2000s, leading to a loss of nearly 80% from peak to trough. If the dotcom boom-bust cycle is indeed a precedent for crypto, the inevitable forecast would be an impending collapse in the value of cryptocurrencies. In this article, we drill below the surface similarities of the dotcom and crypto markets and examine the behavior of market participants during selloffs in both scenarios. We find that investor responses are markedly different, suggesting that forecasts of an impending sustained loss of value in the crypto space may be exaggerated. We conclude by providing tentative justification for the hypothesis that cryptocurrencies may in fact represent an entirely new asset class.
Dotcom vs Crypto: disruptive innovations
The potential for technologically based disruption drives much of the comparison between crypto and the internet. Inevitably, every market downturn reopens the debate about the soundness of the entire crypto ecosystem and blockchain’s capacity to achieve the ambitious promise of disrupting the whole business landscape. By comparison, the internet has disrupted and fundamentally changed our world, but this process took over a decade. We now contrast investor behavior during market downturns along two dimensions: the direction of investor interest, and the statistical relationship between return and volatility. Throughout the subsequent analysis, we use the Nasdaq index as a proxy for investor involvement in the internet, and Bitcoin prices to represent investor interest in crypto.
Contrasting investor behavior during downturns
A rush for the exits or a buying opportunity?
The vast majority of early dotcom companies failed dismally. Equity investors woke up to their overinflated valuations in early 2000, resulting in a falling Nasdaq market, sustained selling, and increased volatility of the index. Figure 1 shows that, following the crash of March 2000, it took 15 years for this market to reattain its previous high.

Bitcoin (BTC), the largest cryptocurrency by market cap, reached its all-time high in April 2021, followed by a severe downturn, with losses of close to 50% over a mere three months. As shown in Figure 2, Bitcoin subsequently hit new highs in November 2021 before tumbling again in early 2022.

In contrast to the Nasdaq after the crash in early 2000, however, the rising numbers of investor involvement in the cryptocurrency market hint that the dotcom boom and bust may not be a precedent for the crypto market. Figure 3 shows the historical price time series and the aggregated number of addresses on the blockchain. The steady increase in the number of wallets is a signal of constantly growing investor interest in the cryptocurrency sector. The continued creation of new wallets suggests that investors are not scared by significant market downturns. Even a drop of over 50% for Bitcoin (in 2021) did not result in a fire sale, but instead seemed to attract still more market participants. In the past two years, there has been a tendency for new entrants to purchase cryptocurrencies even during market turmoil. This contrasts considerably with the behavior of Nasdaq investors during the market selloff in 2000.

The relationship between price and volatility: greed vs. fear
Next, we examine the correlation between the price of Nasdaq versus its volatility and the same correlation for Bitcoin. The relationship between the time series of prices and their volatility has been studied extensively across many asset classes and multiple periods. It is typically the case that an asset’s volatility increases as its price declines. Several factors can explain this. First, the impact of margin calls: investors who use their purchased assets as collateral against a levered portfolio may be forced to sell some of those assets, since the price decrease and the asset’s collateral value fall in lockstep and trigger margin calls. Second, psychology: it is understood that investors are prone to panic in falling markets (“losses loom larger than gains” (Kahneman et al., 1993)), so that selloffs trigger fear-driven further selloffs. This vicious cycle also generates increased volatility. Thus, the correlation between many assets’ price and their volatility is typically negative and becomes increasingly so in falling markets. As prices go down, volatility goes up.
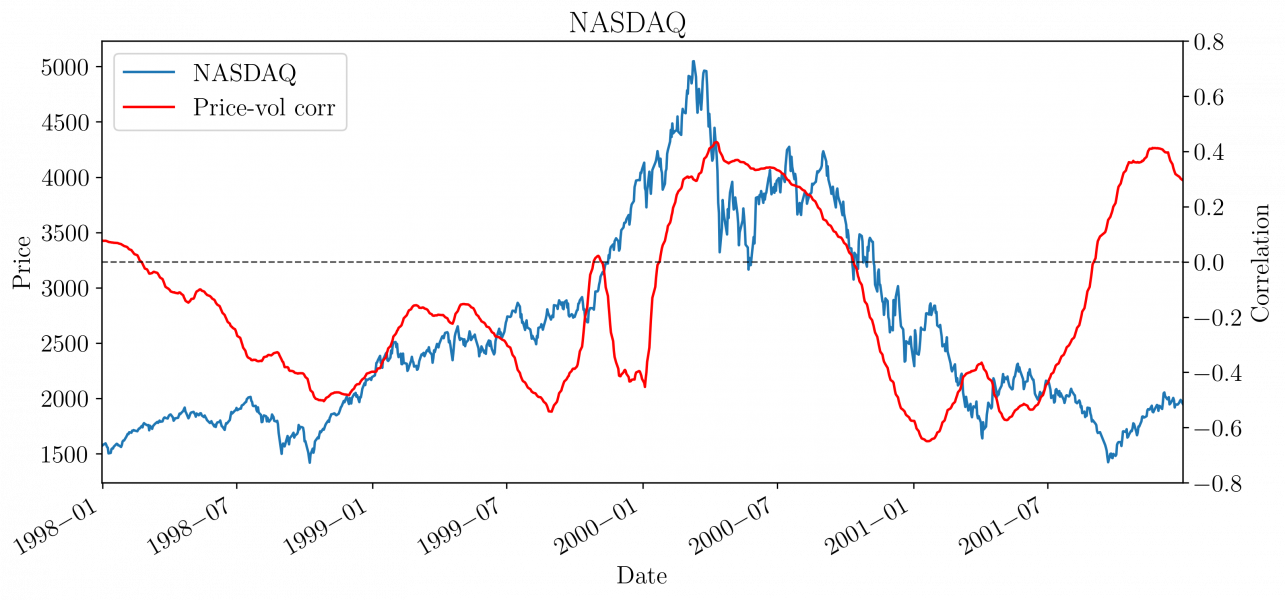
We estimate price volatility for Nasdaq and Bitcoin using the widely accepted GARCH conditional volatility model (Bollerslev, 1987). We then estimate a rolling correlation between each price and its GARCH volatility to obtain the time series of the correlations.
We see that for the Nasdaq, the correlation between its level and its volatility is indeed primarily negative (the red line in Figure 4 below). We observe this mainly when Nasdaq is falling – volatility increases as investors rush to exit.
In contrast, BTC in Figure 5 exhibits more extended periods of positive correlation between price and volatility. The observation that volatility actually goes down as prices fall strongly suggests that investors use price reductions as buying opportunities, rather than as a cause for panic. This is so unusual that it suggests that we are dealing with not just a new asset, but in fact a new and evolving asset class.

A new asset class?
We are still in an early phase of the life of the cryptocurrency market; most of the traded volume still takes place on centralized exchanges. The increasing number of new wallets and the persistent positive price-volatility correlation during market downturns demonstrate a critical difference relative to equity markets such as the Nasdaq. The very transparency of the crypto wallet count (see Figure 3) – a metric unavailable in traditional assets – provides further evidence of the uniqueness of cryptocurrencies. In cryptocurrency, the emotional component also seems to play a different role. Investors’ behavior shows less evidence of panic in the face of losses; instead, we see a combination of the fear of missed buying opportunity (“FOMO”: fear of missing out (McGinnis, 2004)), and the excitement for this technology-enabled and decentralized space.
In summary, the Nasdaq crash of 2000 had investors rushing for the exits; however, equally dramatic drops in crypto prices appear to be viewed as buying opportunities for both existing and new entrants.
References
Bollerslev, T. (1987). A conditionally heteroskedastic time series model for speculative prices and rates of return. The review of economics and statistics, pages 542–547.
Kahneman, D., Fredrickson, B. L., Schreiber, C. A., and Redelmeier, D. A. (1993). When more pain is preferred to less: Adding a better end. Psychological science, 4(6):401–405.
McGinnis, P. J. (2004). Social theory at hbs: Mcginnis’ two fos. The Harbus, 10(5).